How many anime are there? 3/3
Understanding of the Japanese animation industry has grown greatly in English-speaking circles. However, although in-depth recordings or detailed anecdotes about specific productions have become easier to find, a general overview of the industry as a whole is still lacking. This series doesn't aim to deliver anything half as ambitious, but it does hope to provide some of the resources needed to move in that direction.
The aim of this series is therefore to offer a quantitative perspective on the Japanese animation industry, sharing some of the figures and data available in Japanese, but not in English. Numbers are not absolute, nor are they the key to a final, "objective" approach to the animation industry. But they can help us obtain a distance and perspective that the usual, qualitative approach does not, or rarely, have. Each entry in this series will therefore use different sources, on various topics related to the animation industry, in the hopes of clarifying and improving our overall knowledge on this subject.
The first entry in this series, looking at the total number of anime produced, is available here . The second, dedicated to animation studios, is available here .
When we denounce the functioning of the animation industry (or any industry), the expression that comes up most often is that of “poor working conditions”. “Working conditions” is a vague term encompassing several things, not all of which can be captured statistically – from salary to subjective well-being, working hours and tools used. This concluding piece will therefore not provide a general overview of this issue. It will do so even less given the datasets used, each of which will be discussed in more detail. Anyway, we now move from the general situation of the industry to concrete cases, which in itself remains valuable.
Like the previous two pieces in this series, let's start with the question "how much?" - in this case, how many people work in the animation industry? There is, to my knowledge, no definitive answer to this, but there is a 2020 survey providing an estimate of the number of animators currently active in Japan. These figures remain approximate due to the way they were collected, using the Japanese Animation Staff Database - which is useful, but not complete: of the 196 television works registered for 2019, they had only access to credits than 114. However, I think we can take the figures with a margin of plus or minus 10% . The final results were as follows:
- Total number of genga and dai-ni genga credits : 25268
- Number of artists credited after removing duplicates: 5247
- Total number of production assistance credits: 1478
- Number of production assistants credited after removing duplicates: 964
Given that we have the number of minutes of animation broadcast on television, it would be possible and even tempting to estimate how many minutes of animation each animator produces on average each year. You are free to do this calculation yourself, but the results would not be very indicative, because the survey includes in its count of "key animators" those responsible for the second key of animation - making it difficult to correctly determine how many “ new ” and “original” designs are made.
The same method was applied to "in-betweeners", but the results are much more inconclusive, because "in-betweeners" are most often not credited: the final number was only 1854 people. What's interesting, however, is what the author of the survey does from there: by separating foreign artists and companies from Japanese, he goes on to calculate how much animation is produced in Japan and how much abroad. I'll spare you the details of the calculation, and it's important to keep in mind that these figures are very approximate, but the conclusion is that, for the 93 productions taken as a sample in 2019, only 33% of in-betweeners could have been produced in Japan - which clearly shows the unsustainability of Japanese industry.
Now, let's move on to more specific details about the Japanese personnel. The data this time comes from surveys carried out by JANICA between 2005 and 2019. It is important to note two things beforehand:
1) This is not representative of the entire industry - the number of respondents increases from 83 in 2005 to 759 in 2015
2) Although the information remains focused on animators - in 2019, around half of the respondents were key animators - the results bring together several very different statuses, from series directors to artists of color and 3D animators.
Anyway, let's start by getting a general idea of the profile of the respondents. One question that is commonly raised regarding animators in Japan is age - it is said that fewer young people are joining the industry. Comparing the results of the 4 surveys over time, it is difficult to reach a definitive conclusion: yes, the average age of respondents in 2019 is significantly higher than in 2005, but this is not a continuing trend , because the 2009 figures are decreasing rather than increasing. But it is true that, if we exclude 2009, the average age of respondents continues to increase . These results are partly supported by the fact that respondents' overall industry experience is also increasing, although more inconsistently.

Average age and years of experience of survey respondents over time
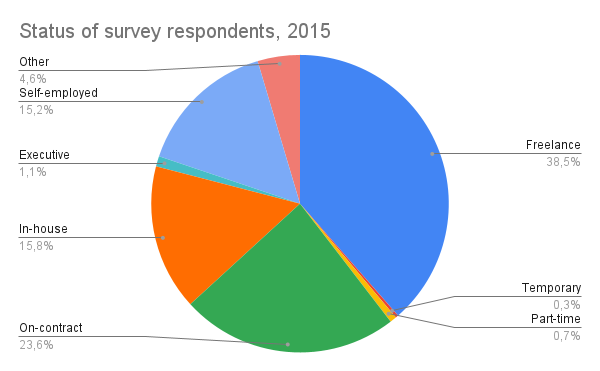
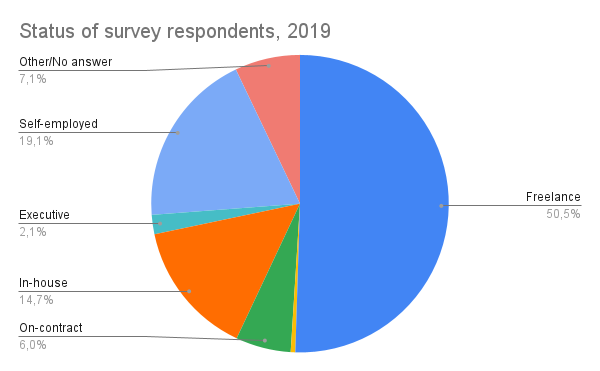
Now let's move on to the statuses of the animators. Simplifying a little, there are three main statuses for animators: in-house, permanently and exclusively attached to a single studio; under contract, temporarily attached to a studio (sometimes exclusively, sometimes not), most of the time for the duration of a production; freelance, not attached to a structure. The JANICA survey refines this by adding statuses such as "independent" or part-time. A comparison of the 2015 and 2019 surveys gives surprising results: freelancers have always been in the majority, but their proportion has increased from 37 to 50%. On the other hand, the proportion of contract workers has decreased while that of internal workers has remained constant.


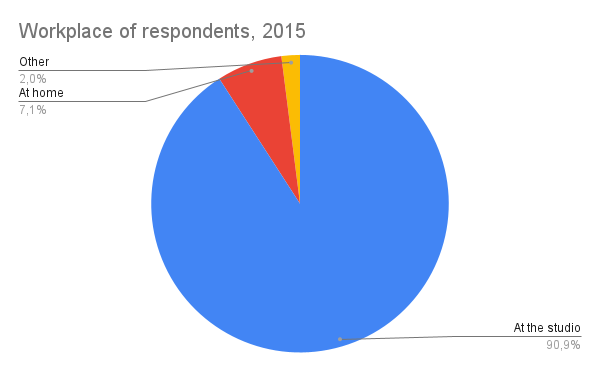
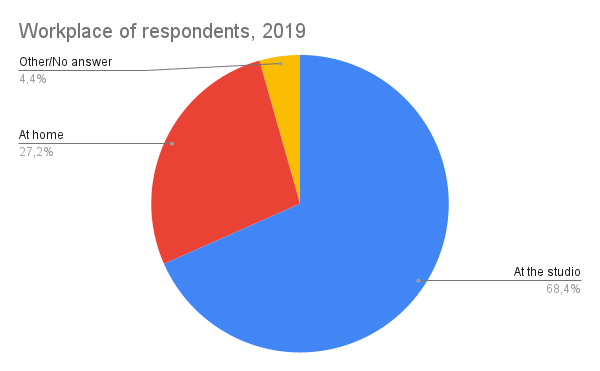
However, it is difficult to draw a definitive conclusion from these figures, because we do not know if the respondents from 2015 and 2019 are the same people. If they are, we could conclude a definitive increase in the self-employed, but this would be more difficult to say if they are not. However, there is another trend that seems remarkable: that of an increasing number of people working from home in 2019 compared to 2015, as shown in the graph below. The pandemic cannot be blamed here, and the gap between the two surveys is wide enough that the conclusion is fairly assured. Possible factors, then, could be the increase in freelance work and the decrease in the ability of studios to accommodate people in their facilities - perhaps indicating a trend of studios becoming smaller and smaller.


Now, let's move on to the last topic, perhaps the one most people think of when they mention "working conditions": salary and working hours. For salaries, here are the figures from the 2019 survey:
- Average annual salary of 4.48 million yen
- Median annual salary of 3.7 million yen
These figures must be put into two perspectives:
- Compared to the average and median salary in Japan. In 2019, the average annual salary was around 4.8 million, so only slightly higher than that of animators. However, in Tokyo, it appears that the average salary in 2019 was 6.2 million yen - that is, much higher than that of animation workers living in the capital .
- Compared to other figures over time. The figures provided by the various surveys are not complete, but from 2009 to 2019, there is a clear increase in the average annual salary .
In fact, just as wages appear to have increased, the number of working hours has decreased , as the chart below shows - although their numbers are extremely high in the first place.

Average number of hours of work per day & days off per month of respondents over time
But once again, we need to be careful about where the data comes from - are these the same people working less, or did 2019 respondents simply work less than those in previous years, for reasons not included in the investigation? Furthermore, it is necessary to take into account the fact that, according to the written reports of the 2019 survey, the unit cost of animation has not increased, making it difficult to reconcile higher salaries and shorter working times. Finally, average data is just that - average. Although we notice the same upward trend for salaries, note how the median figures are still significantly lower than the average figures . To put this into perspective, it is also necessary to consider how they are not distributed evenly according to each position in the production chain
In my opinion, the data presented here as a whole is too inconclusive to state whether or not "working conditions" in the animation industry are significantly improving . This may not have been intended to answer such a question in the first place - as I wrote above, "working conditions" is something too complex to fully understand with statistics .
However, while there may be improvements on some fronts, the fact remains that working conditions are poor: at least in what is quantifiable, wages remain low and working hours long. In addition, it is necessary to put these figures into perspective with those of the previous message, on the studios: many anime studios remain in very difficult situations, and the quality of working conditions probably varies widely depending on each studio , of its own state and its strategy.
By closing by saying that the data is inconclusive, it might seem that neither this article nor the previous two in this series have taught us anything. However, my goal here was not to get such definitive answers: rather, it was to try to see what data was available and how it might support or refute some of our hypotheses about the animation industry. If there is one conclusion to be drawn, then it is that reality is complex and that a more general point of view can shed light on many things that on-the-ground perspectives cannot. But they are not contradictory, and I hope that they can complement each other even more in the future.


